Somtimes a Chart Jumps Out and Grabs Your Attention - Like This One
Here's a chart that jumped out at me and grabbed my fleeting attention by the scruff of my brain. It's visually stunning of course, but what it might mean is even more so.
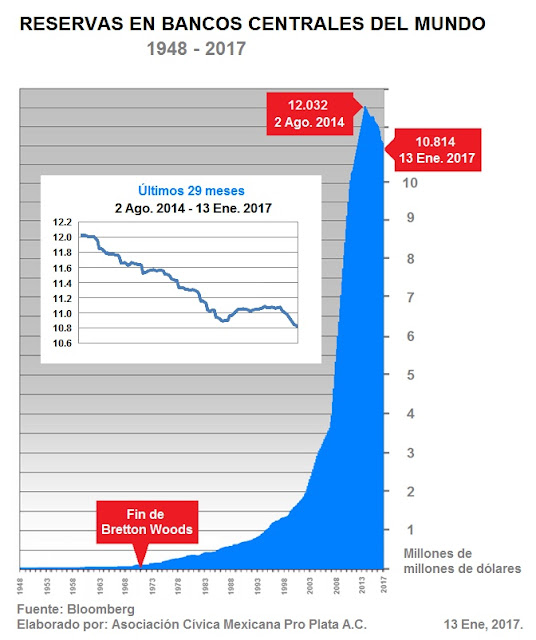
We're looking at the increase in international reserves since the end of the Bretton Woods Agreement. The fellow who posted this, Hugo Salinas Price, explains:
Back to the chart, if it's telling us there's a fundamental change going on, it's big news. The 2007-2009 financial crisis resulted from a credit crisis - a lack of liquidity that almost caused the collapse of the world''s financial system. It originated in the U.S and caused world-wide consternation because the U.S. economy and financial markets dominate the world's economy and markets. In response to the crisis, as you can see in the chart, credit continued to expand as central banks created endless streams of "liquidity" to forcibly keep markets functioning in the face of the lack of liquidity that caused them to seize up. And it worked. Things eventually got back to something resembling (although not quite being) "normal."
So what's changing now? Well, as Salinas explains,
But now the author believes that jig is up. While he's not really clear on exactly why the central banks won't just print more money as they have since 1971 (the end of Bretton Woods), he does leave us with this rather dire message:

We're looking at the increase in international reserves since the end of the Bretton Woods Agreement. The fellow who posted this, Hugo Salinas Price, explains:
The decline in the total of International Reserves is a clear sign of world credit contraction.Looking at this simplistically, when credit expands the economy hums along, and markets generally go along. When things reverse, we're looking at recession and bear markets. In fact, the argument can be made that the stock market performs well in credit expansions and not well when credit contracts. It's an argument that tells us to focus on whether credit is expanding or contracting, superseding any consideration of fundamental values and various studies in technical analysis. Of course, these are all related, so it doesn't mean that value, trends, volume studies, etc are irrelevant. It does, however, mean that credit expansion and contraction determines the big trend in the economy and the markets. So it's worth monitoring this on a regular basis. It's not the sexiest sort of study, since it's long-term in nature, and therefore you can't generate a lot of drama or excitement as markets go through their usual ups and downs. But, really, it's the long-term trend that matters most. Get that right, and you'll do OK. Get it wrong and you can be wiped out.
Back to the chart, if it's telling us there's a fundamental change going on, it's big news. The 2007-2009 financial crisis resulted from a credit crisis - a lack of liquidity that almost caused the collapse of the world''s financial system. It originated in the U.S and caused world-wide consternation because the U.S. economy and financial markets dominate the world's economy and markets. In response to the crisis, as you can see in the chart, credit continued to expand as central banks created endless streams of "liquidity" to forcibly keep markets functioning in the face of the lack of liquidity that caused them to seize up. And it worked. Things eventually got back to something resembling (although not quite being) "normal."
So what's changing now? Well, as Salinas explains,
Ludwig von Mises pointed out many years ago, that once a central bank indulges in expansion of credit by lowering the rate of interest it charges on loans, it cannot stop expanding credit: it has to go on expanding credit by lowering even more, the interest rate it has set. If the central bank decides to let the market once again set the interest rate, then the previous expansion will turn into a general a liquidation, to clear out the malinvestments created by the artificially induced expansion. If the central bank does not allow the market to set the interest rate, then the expansion of credit will continue until it produces the crack-up boom, which is followed by a massive debt liquidation.Still, this doesn't tell us why the central banks may decide to let the market once again set the interest rate. Could it be that the negative rates that have prevailed in so many countries over the past two years were seen as a problem? The negative rates were the product of central banks continually lowering interest rates until they hit zero. At that point, there was nowhere else to go. And, one assumes, central banks feared that if they let rates rise, the house of cards built since 1971 would collapse. And so they went negative - as crazy as that seemed to some at the time.
But now the author believes that jig is up. While he's not really clear on exactly why the central banks won't just print more money as they have since 1971 (the end of Bretton Woods), he does leave us with this rather dire message:
...I am led to believe that 2017 will be a year of economic chaos for the world; the contraction of credit in the world in 2017 will manifest itself in the form of bankruptcies at all levels, destruction of financial assets, collapsing prices, massive unemployment, currency devaluations left and right, and of course, world-wide political instability.Of course, we've seen these warnings before - many time in fact. And somehow the central governments and banks seem to keep dancing and kicking the can down the road. While I'm not losing sleep over this guy's prediction, there's still the matter of that chart. It really is something to behold, isn't it?
Comments