It's Time to Remember: Markets Breathe In and Out
If you follow markets, you've likely seen the ups and downs since January. So where do things stand now?
Well, we read a week or so ago that the stock market was now "overbought." The price had risen fast and quick from its February lows. Earlier this year, the same could be said for gold. And the precious metals mining shares are likely the most dramatic example of this with many mining companies more than doubling in price since they bottomed on Janaury 19th.
So...a correction or at least a rest always comes at some point. Nothing grows to the sky.
The same holds when prices drop - although they can sometimes dramatically drop farther and faster than they might dramatically rise. Nevertheless, even in such plunges, while it may feel like the price will land at zero, that's not what happens. When all hope is lost, at some point there's a turnaround - even if it's only a correction in an ongoing bear market.
With that understanding, here's another way to consider recent price movements, whether we're looking at gold, stocks, or mining shares: Markets breathe in and out.
Just as you and I cannot breathe in without subsequently breathing out, prices of financial assets behave similarly. The reason why is more important than the comparison. It's not just that prices behave like human beings; rather, it's that prices behave as they do because they are ultimately determined by human beings. Unlike the operations of machines (if they're reasonably well made), variance would be the rule not the exception. Economies aren't machines.
But what about those high frequency trading operations - you know, the ones that program algorithms into powerful computer software and trade massively in milliseconds? Indeed, most of the trading volume these days finds its source in these operations rather than the individual or even the institutional trading executed by trading desks taking orders from humans. Well, the human touch remains here. The programs spring from the minds of math geeks directed in their efforts by "geniuses" who think they can get an edge on the markets using high tech. Still human at some level.
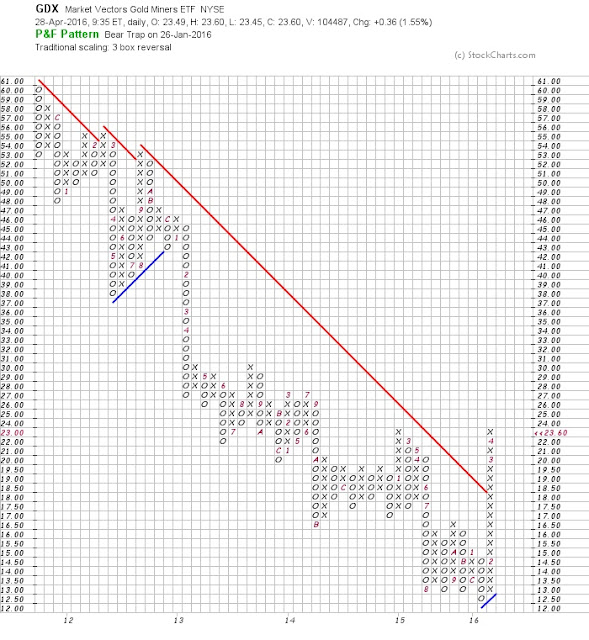
In any case, it's helpful to think of market price movements this way. This chart of the recent action of GDX (gold miners ETF) illustrates this. It's P&F (point and figure) chart. The last row of "x's" looks its rising to the sky. It won't. Knowing that may cause you not to jump in right now with two feet. Here's the chart:
Well, we read a week or so ago that the stock market was now "overbought." The price had risen fast and quick from its February lows. Earlier this year, the same could be said for gold. And the precious metals mining shares are likely the most dramatic example of this with many mining companies more than doubling in price since they bottomed on Janaury 19th.
So...a correction or at least a rest always comes at some point. Nothing grows to the sky.
The same holds when prices drop - although they can sometimes dramatically drop farther and faster than they might dramatically rise. Nevertheless, even in such plunges, while it may feel like the price will land at zero, that's not what happens. When all hope is lost, at some point there's a turnaround - even if it's only a correction in an ongoing bear market.
With that understanding, here's another way to consider recent price movements, whether we're looking at gold, stocks, or mining shares: Markets breathe in and out.
Just as you and I cannot breathe in without subsequently breathing out, prices of financial assets behave similarly. The reason why is more important than the comparison. It's not just that prices behave like human beings; rather, it's that prices behave as they do because they are ultimately determined by human beings. Unlike the operations of machines (if they're reasonably well made), variance would be the rule not the exception. Economies aren't machines.
But what about those high frequency trading operations - you know, the ones that program algorithms into powerful computer software and trade massively in milliseconds? Indeed, most of the trading volume these days finds its source in these operations rather than the individual or even the institutional trading executed by trading desks taking orders from humans. Well, the human touch remains here. The programs spring from the minds of math geeks directed in their efforts by "geniuses" who think they can get an edge on the markets using high tech. Still human at some level.
In any case, it's helpful to think of market price movements this way. This chart of the recent action of GDX (gold miners ETF) illustrates this. It's P&F (point and figure) chart. The last row of "x's" looks its rising to the sky. It won't. Knowing that may cause you not to jump in right now with two feet. Here's the chart:

Comments